Data visualization (Tableau)
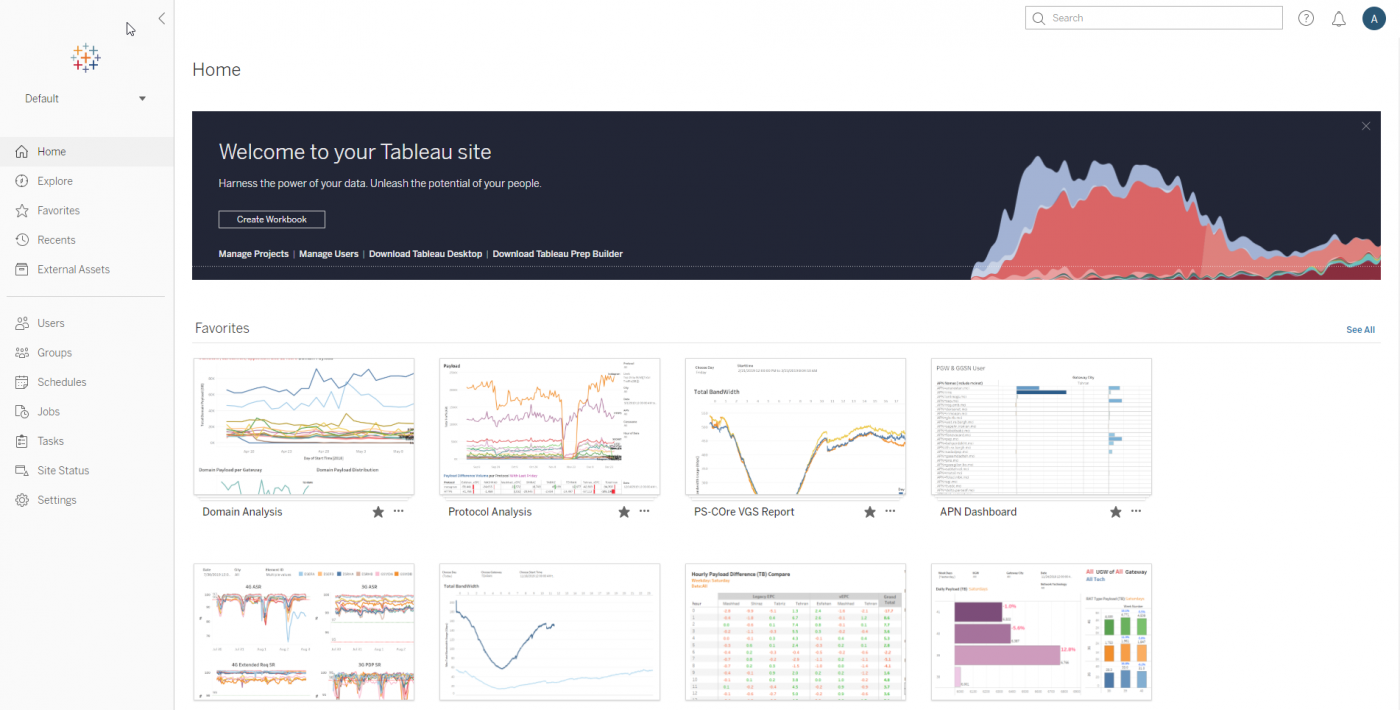
Tableau is business intelligence (BI) and analytics platform created for the purposes of helping people see, understand, and make decisions with data. It helps in simplifying raw data into the very easily understandable format.
Tableau Software was founded with a simple mission, to “put the power of data into the hands of everyday people, allowing a broad population of business users to engage with their data, ask questions, solve problems and create value.”


High Performance
Ever increasing need for fast and reliable data access mandates efficient, high-performance SAN storage systems. Performance metrics in data storage systems.

Responsive Design
Responsive web design is about creating web pages that look good on all devices! A responsive web design will automatically adjust for different screen sizes.

User Experience
We believe designers are thinkers as much as they are makers. Curated stories on UX, Visual & Product Design.
Kara Solution
Features of Tableau
- It is very easy to utilize.
- You don’t have to be familiar with programming of any sort, all you require is a few data and tableau to generate reports that can visually enchanting and which tells a story which user has to tell their managers or impress their professor in class.
- It has a drag and drops feature by which a user can simply generate stories or reports with drag and drop and a few thoughts.
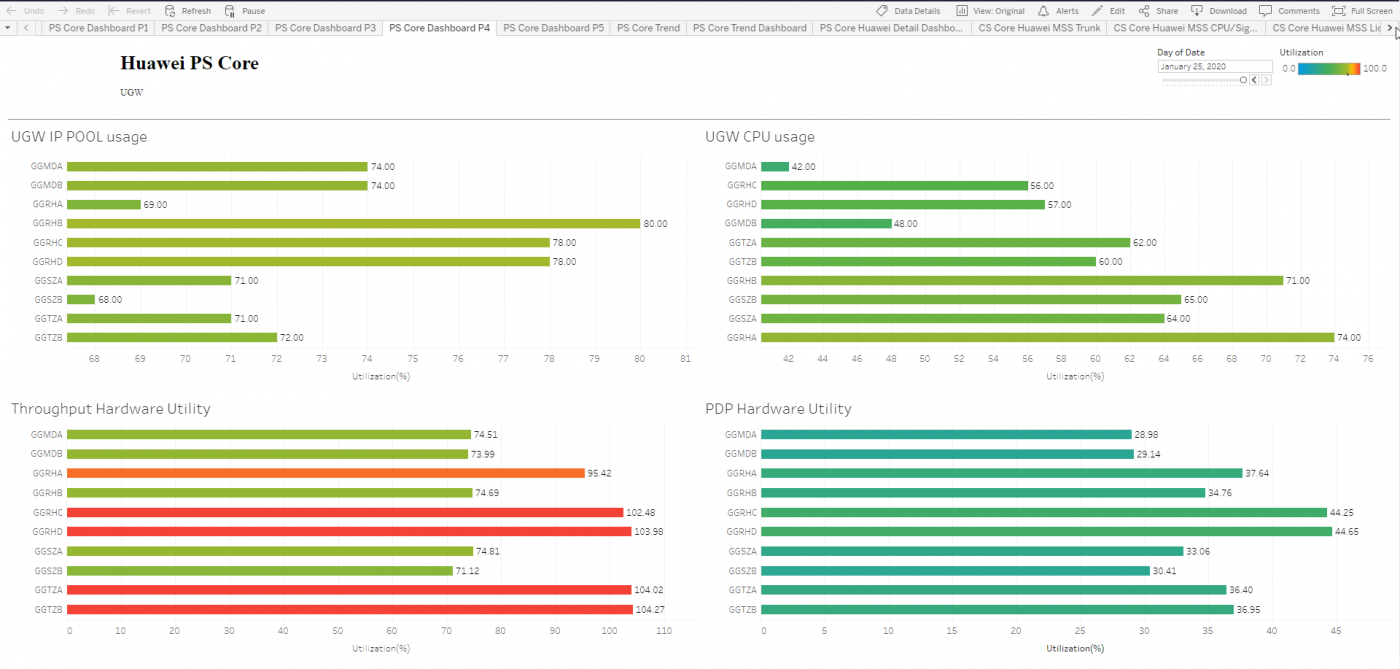
In our company we utilize Tableau software to create interactive dashboards for MCI in order to help managers to get decisions and keep monitoring the systems.

